|
|
Texas OER Performance Report for Admins |
Texas OER Performance Report for Admins
The Texas OER Performance Report is available only if your school or district has purchased the Texas OER Math or RLA Companion.
The Texas OER Performance Report for Admins shows how students across your district or campus are scoring on Texas OER work. Compare schools and courses, then open a teacher’s module to see each student’s scores by topic and lesson.
This report covers your campus or district. Teachers see their own classes in the Texas OER Performance Report.
Open the Report
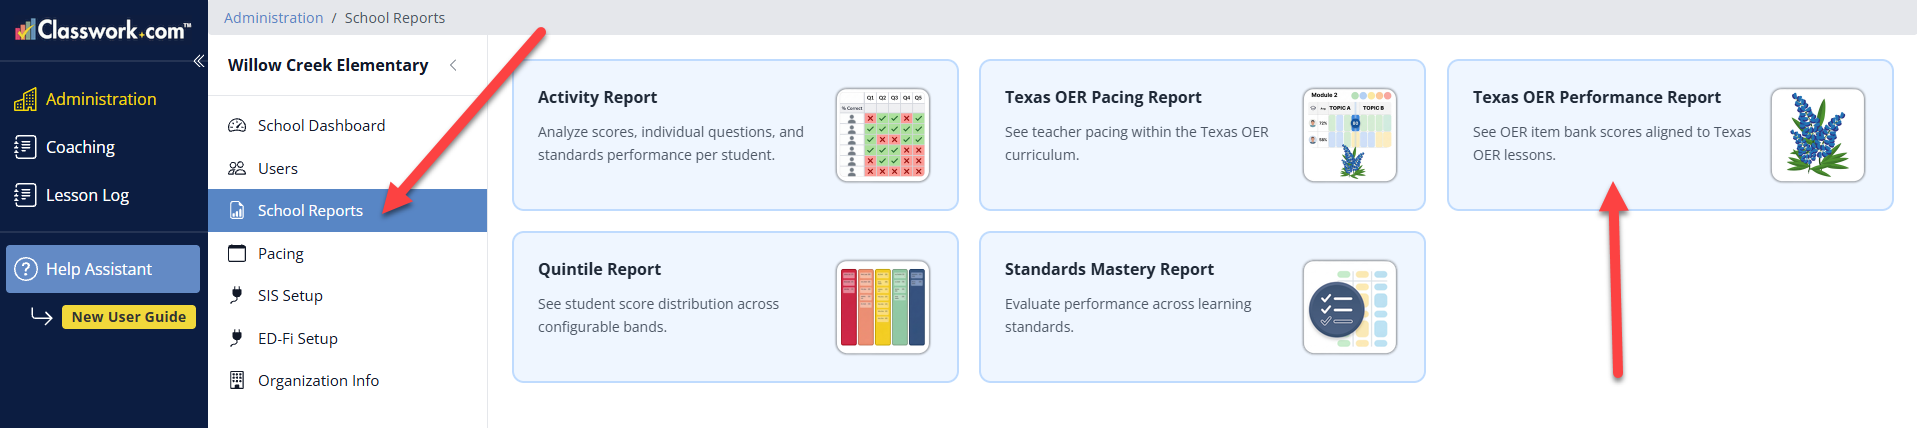
- Click Administration in the left menu.
- Click District Reports (District Admins) or School Reports (School Admins).
- Click Texas OER Performance Report.
You need the District Admin or School Admin role. District Admins see every school in the district; School Admins see their own campus. Give each admin one of the two roles, not both.
Set Your Report Options
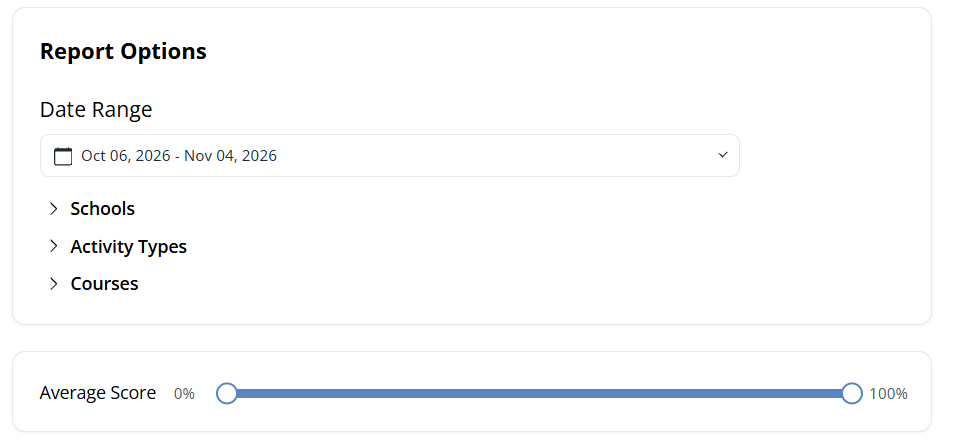
- Date Range: The report starts with the last 30 days. Click the date to pick your school year or a custom range.
- Schools (District Admins): Narrow the report to certain schools.
- Activity Types: Include only certain kinds of work, such as assessments. This option appears if your district’s Curriculum Manager has set up activity types.
- Courses: Include only certain courses, such as just the Math grades or just RLA.
Below the options, the Average Score slider hides scores outside the range you set. Drag the left handle up from 0% or the right handle down from 100%, for example to see only the lowest scores. Click Legend to see what each color means.
District View
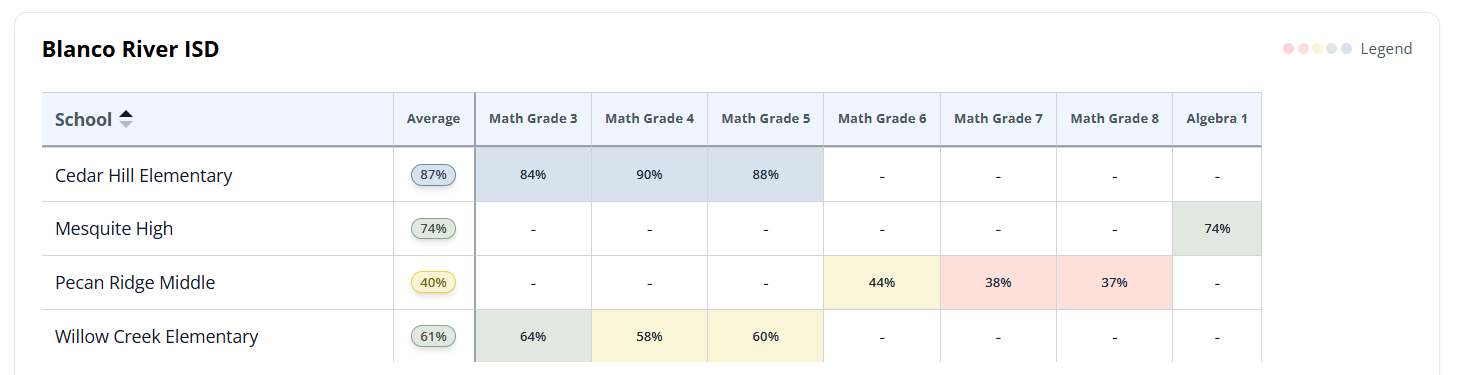
District Admins start with a table of every school in the district:
- Average: The school’s average across all of its Texas OER courses.
- A column for each course (for example, Math Grade 3 through Algebra 1): The school’s average in that course. A dash means the school has no work in that course yet.
Each score is colored by score band. Click a course score to open that course at that school.
School and Course View
School Admins start with a section for each course at their campus. District Admins see one course at one school after clicking a score (for example, Math Grade 5 - Willow Creek Elementary).
Each teacher has an Average and a score for each Module (Math) or Unit (RLA). The column headers show the average for each module, and you can sort by any column. Click a teacher’s module score to see their students.
A Teacher’s Students
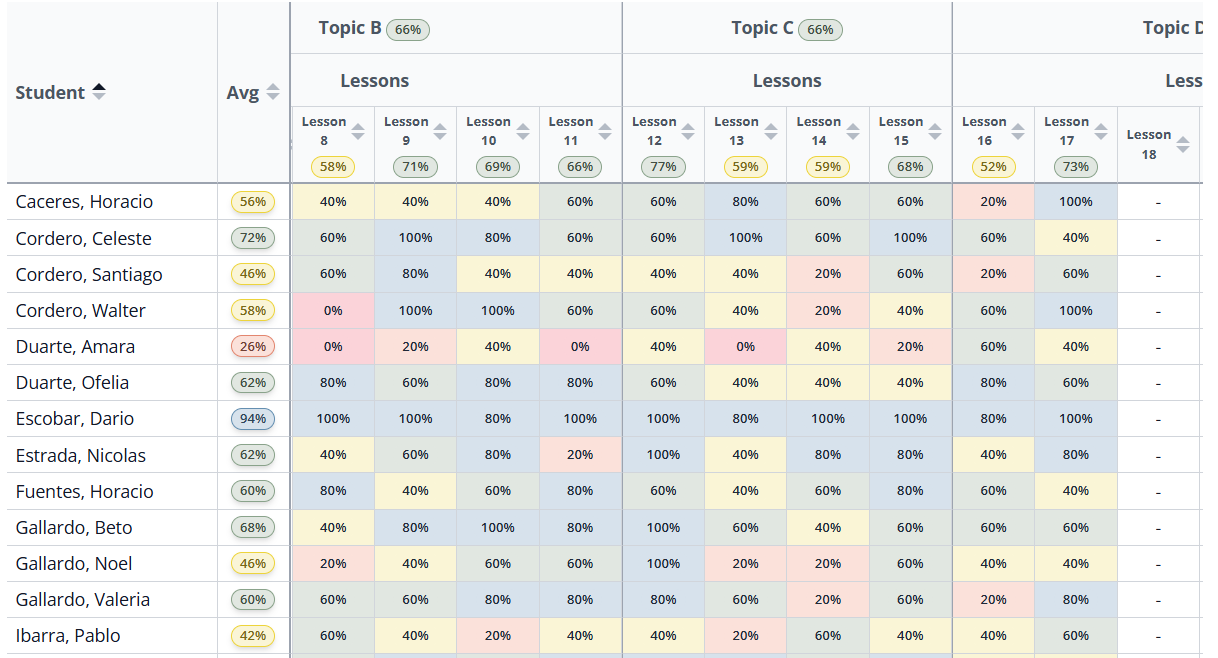
A teacher’s module (for example, Willow Creek Elementary - Lucas Ibarra - Module 4) lists each student with their Avg and a score for every topic and lesson. Topic headers show the average for that topic. Scroll sideways to see every lesson. Here the slider is called Activity Score and works the same way.
This is the same view the teacher sees. See the Texas OER Performance Report article for how to read it.
Click Back to go up one level: from a teacher’s students to the course, and from the course to the district.
Putting It All Together
Use the district table to compare schools and courses, open a course to see which teachers’ modules are lower, then open a module to find the topics and lessons where students need support.
Was this article helpful?
That’s Great!
Thank you for your feedback
Sorry! We couldn't be helpful
Thank you for your feedback
Feedback sent
We appreciate your effort and will try to fix the article