|
|
Quintile Report for Admins |
Quintile Report for Admins
The Quintile Report for Admins shows how students across your district or campus are doing, sorted into five score bands (quintiles). Start with the whole district or campus, compare schools, subjects and teachers, then open any teacher’s own Quintile Report without leaving the page.
This report covers your campus or district. Teachers see their own classes in the Quintile Report.
Open the Report
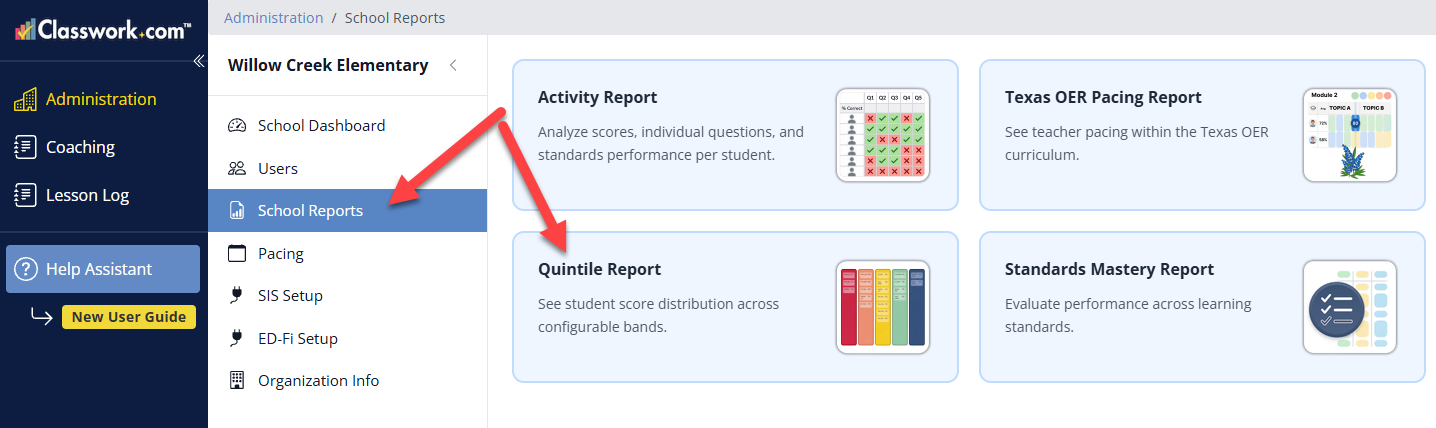
- Click Administration in the left menu.
- Click District Reports (District Admins) or School Reports (School Admins).
- Click Quintile Report.
You need the District Admin or School Admin role. District Admins see every school in the district; School Admins see their own campus. Give each admin one of the two roles, not both. If you don’t see a reports tab, ask your User Administrator to check your role.
Set Your Report Options
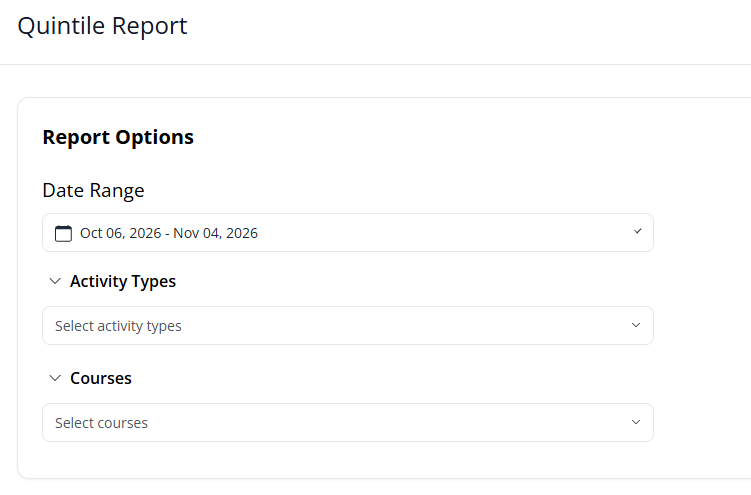
Use Report Options at the top to choose what the report includes:
- Date Range: The report starts with the last 30 days. Click the date to pick your school year (from your school calendar) or choose Custom date range.
- Schools (District Admins): Narrow the report to certain schools. Schools are listed by level (Elementary, Middle, High).
- Activity Types: Include only certain kinds of work, such as assessments or practice. Your district’s Curriculum Manager sets up these types, so this option appears only if your district uses them.
- Courses: Include only certain courses.
Every list has Select all and Clear.
Reading the Band Bars
Each row of the report is a bar split into colored sections, one for each quintile. A section’s width is the share of students in that band, from Quintile 1 on the left to Quintile 5 on the right. The number at the end of the bar is how many students the row includes. Hover over a section to see its exact percentage and student count.
Click Legend to see the score range for each band:
- Quintile 1: 0–19%
- Quintile 2: 20–39%
- Quintile 3: 40–59%
- Quintile 4: 60–79%
- Quintile 5: 80–100%
A student’s band comes from their average score across the work in your date range.
District View
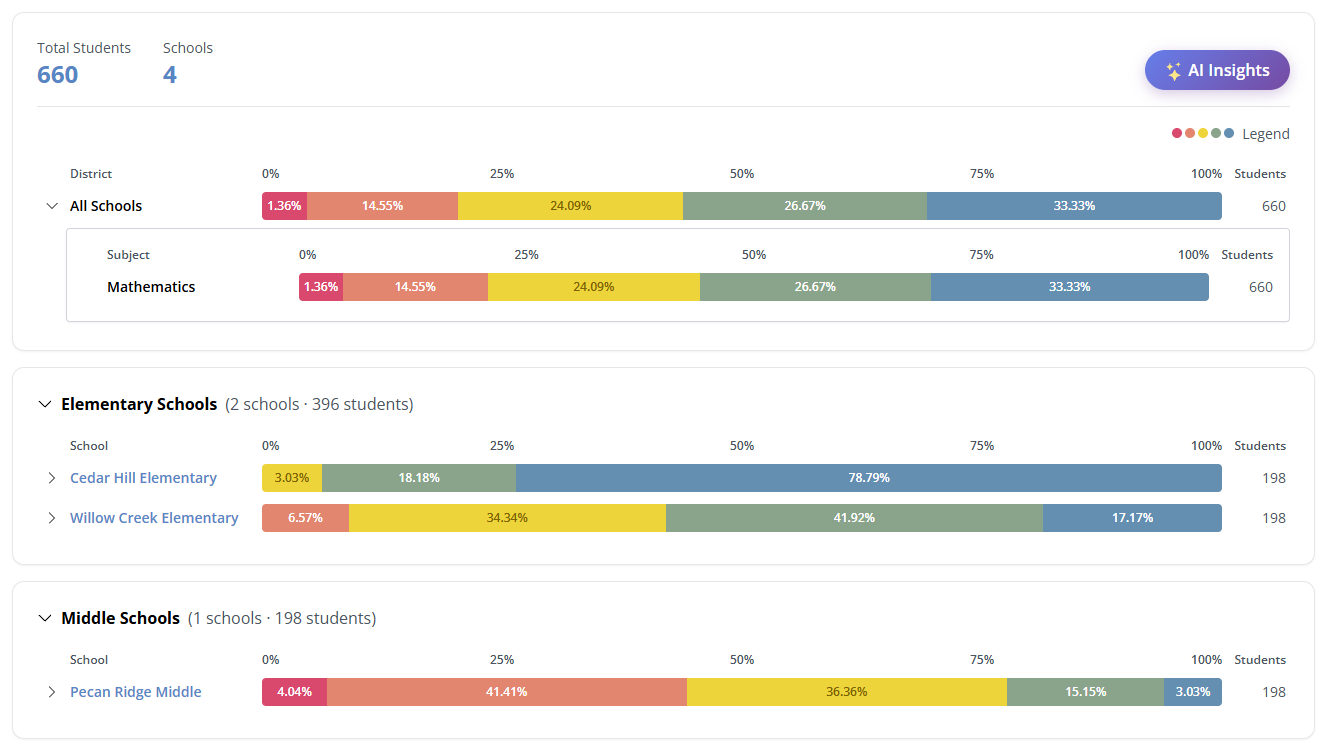
District Admins start with the whole district. The top of the report shows Total Students and the number of Schools.
- All Schools combines the district into one bar. It’s open by default, with a bar for each subject below it.
- Below that, schools are grouped by level, such as Elementary Schools, Middle Schools and High Schools. Each group shows how many schools and students it includes.
- Click the arrow beside a school to see its subjects. Click the school’s name to open that campus.
Campus View
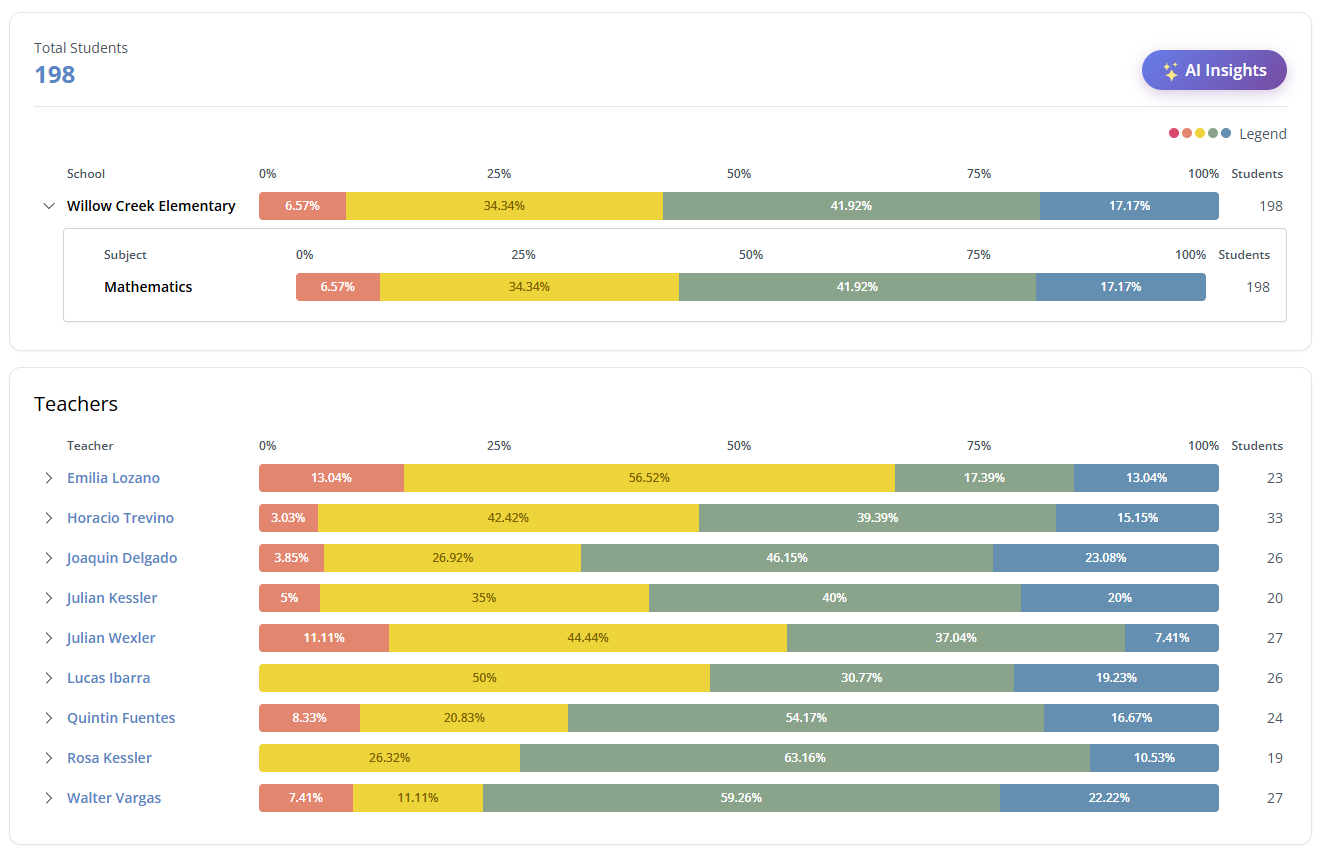
School Admins start here, and District Admins get here by clicking a school’s name. The top shows Total Students, then a bar for the school with a bar for each subject below it.
The Teachers section lists every teacher with their own bar. Click the arrow beside a teacher to see each standards document they teach (for example, Grade 5 Mathematics).
Open a Teacher’s Report
Click a standards document under a teacher to open that teacher’s Quintile Report, already set to that standards document. It’s the same report the teacher sees, with the Summary row and the Grid and Distribution views. Click a student’s name for their standard-by-standard results. See the Quintile Report article for how to read it.
Click Back at the top of the report to go up one level: from a teacher to their campus, and from a campus to the district.
AI Insights
Click AI Insights for a short list of patterns in the data you’re looking at, based on your current Report Options. Each insight is marked Action Needed, Positive or FYI, for example a gap between school levels, or a school well above the district. Click View details on an insight to see the schools behind it compared with the district.
Putting It All Together
Use the district view to compare schools and subjects, check AI Insights for gaps worth a closer look, then open a campus and a teacher’s report to see which students need support.
Was this article helpful?
That’s Great!
Thank you for your feedback
Sorry! We couldn't be helpful
Thank you for your feedback
Feedback sent
We appreciate your effort and will try to fix the article