|
|
Quintile Report |
Quintile Report
The Quintile Report shows how your students are performing on a set of standards over time. Instead of looking at a single assignment, it pulls together every question tagged to the standards you choose, across all assignments in your date range, and sorts students into five performance quintiles.
This report covers your own classes. Administrators can view quintiles across their campus or district—see Quintile Report for Admins.
Open the Quintile Report
From the Classes page, open the Reports tab and select Quintile Report.
Set Your Report Options
Two dropdowns appear at the top of the report:
- Standards Document: Choose the course whose standards you want to analyze (for example, Grade 3 Mathematics). This loads all of the standards in that course.
- Date Range: Optional. Click once on the calendar to set the start date, then click again to set the end date. If you don’t set one, the report uses the date range selected at the top of the Classes page.
Once you choose a standards document, two more filters are added directly beneath the first two dropdowns:
- Select Standards: Narrow the report to specific standards from the document.
- Select Questions: Filter by Bloom’s Taxonomy, Webb’s DOK, and question type (Multiple Choice, Multi-Select, and so on).
The report then groups students into quintiles based on their performance for the selected date range—across every question on every assignment that has those standards tagged to it.
Summary Statistics
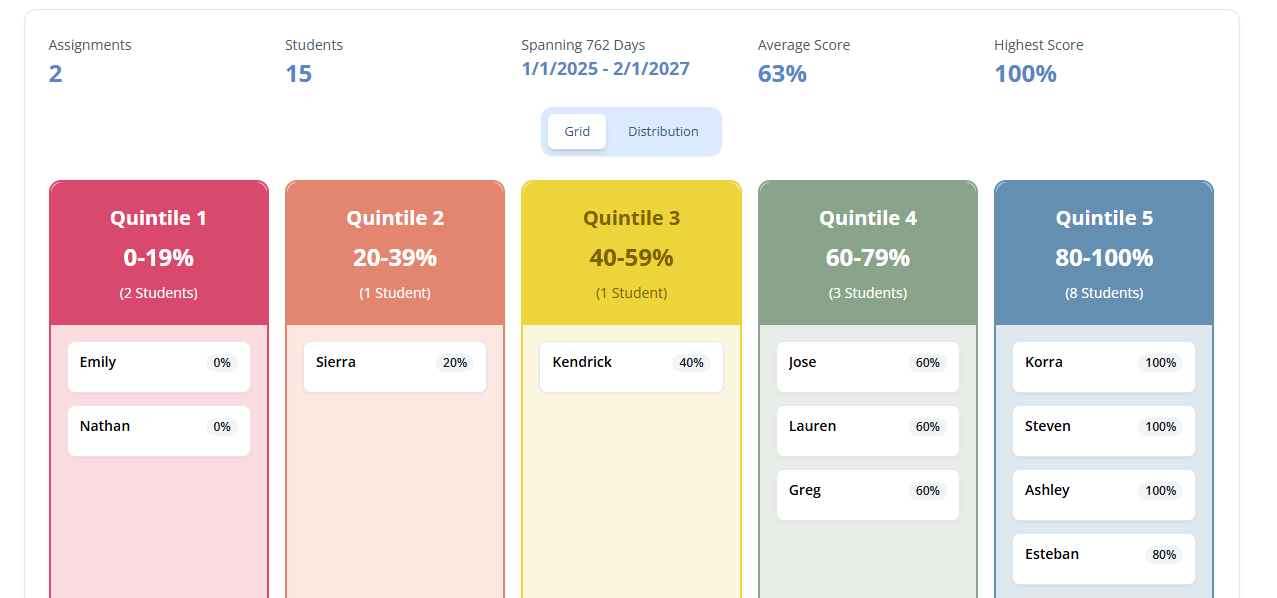
A stat row across the top of the report summarizes the data behind it:
- Assignments: How many assignments are included.
- Students: How many students are included.
- Spanning: The number of days covered, with the exact date range.
- Average Score: The average score across all included students.
- Highest Score: The top score among included students.
Grid & Distribution Views
Use the Grid and Distribution tabs to switch between two ways of viewing the same data.
Grid View
The Grid view places each student into one of five color-coded quintiles, based on their average score across the selected standards within the date range:
- Quintile 1: 0–19%
- Quintile 2: 20–39%
- Quintile 3: 40–59%
- Quintile 4: 60–79%
- Quintile 5: 80–100%
Student Performance Details
Click any student’s name to open the Student Performance Details popup. It shows the student’s overall score, followed by a Standards Performance breakdown. For each selected standard, you’ll see:
- The student’s average score on that standard.
- How many questions were asked on it.
- How many assignments those questions came from.
Click the ? icon next to a standard code to reveal the full text of the standard.
Click the assignment count (for example, 1 assignment) to expand a list of every assignment where that standard was assessed, along with the student’s score on each one.
Distribution View
The Distribution view displays a bar graph showing where your class(es) fall across the score range. Students are grouped into 5% buckets (0–4%, 5–9%, and so on up to 95–100%), and the bars are color-coded by quintile. The height of each bar shows how many students landed in that bucket—making it easy to see the overall shape of your class’s performance.
Putting It All Together
The Quintile Report gives you a longer-term, standards-based view of mastery—showing not just how students did on one assignment, but how they’re trending across everything tied to the standards you care about. Use the Grid to identify which students need support and the Distribution to gauge how your whole class is progressing.
Was this article helpful?
That’s Great!
Thank you for your feedback
Sorry! We couldn't be helpful
Thank you for your feedback
Feedback sent
We appreciate your effort and will try to fix the article