|
|
How Do I Graph Absolute Functions? |
Can I Graph Absolute Value Functions?
Not yet. The Graphing question can’t plot absolute value functions in either editor. If you’d like this added, email support@classwork.com.
What Graphing can do
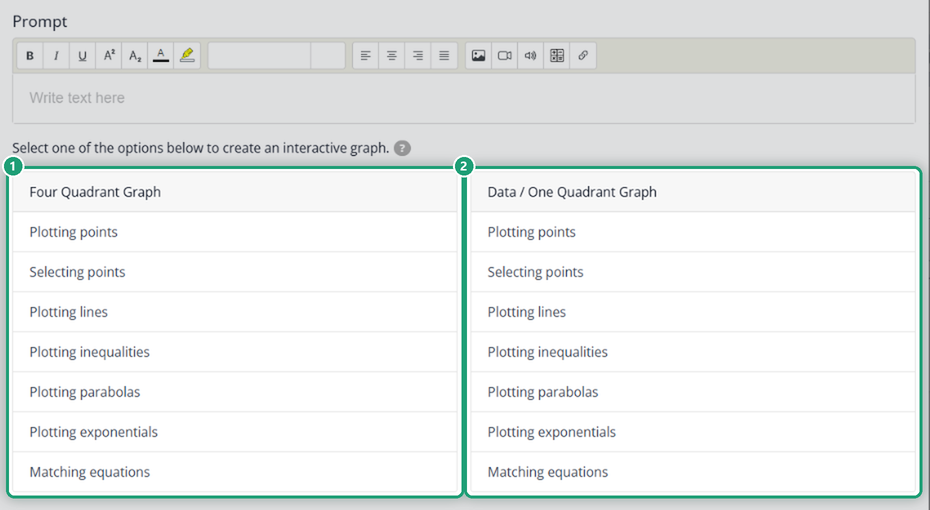
On a Four Quadrant Graph or a Data / One Quadrant Graph, students can plot or select points, and plot lines, inequalities, parabolas and exponentials.
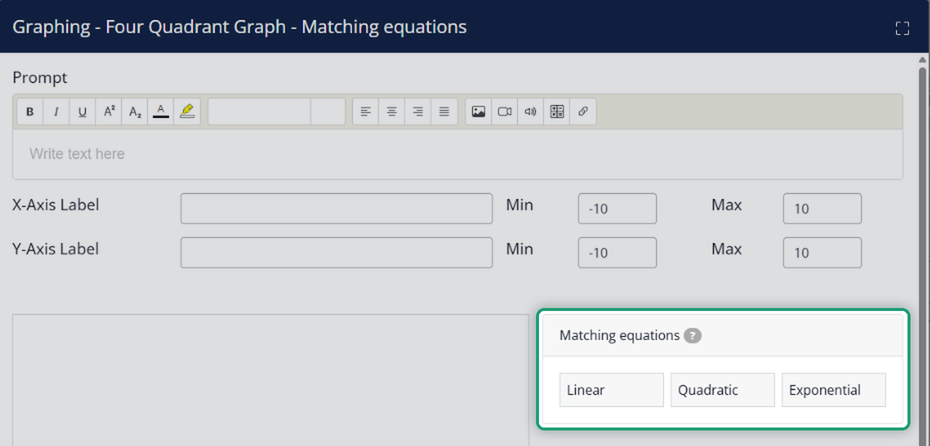
Matching equations covers Linear, Quadratic and Exponential equations only.
Workaround: for an absolute value function, use Plotting points. Ask students to plot the vertex and a few points on each side, and add those points to the answer key.
To set up a Graphing question, see Using the Graphing Question Type.
Was this article helpful?
That’s Great!
Thank you for your feedback
Sorry! We couldn't be helpful
Thank you for your feedback
Feedback sent
We appreciate your effort and will try to fix the article