|
|
Using the Bar Graph Question Type |
Bar Graph Question Type
In a Bar Graph question, students answer by clicking each bar up to the right value. You name the axes, set the scale and the bars, then click each bar to the correct height. Classwork.com scores it automatically.
Add a Bar Graph in the Flex Editor
- Click + Add.
- On the Add Item tab, under Math, click Bar Graph.
- The Edit Bar Graph window opens. Type the question in Prompt, build the graph and set the correct answers (see below), then click Save Bar Graph.
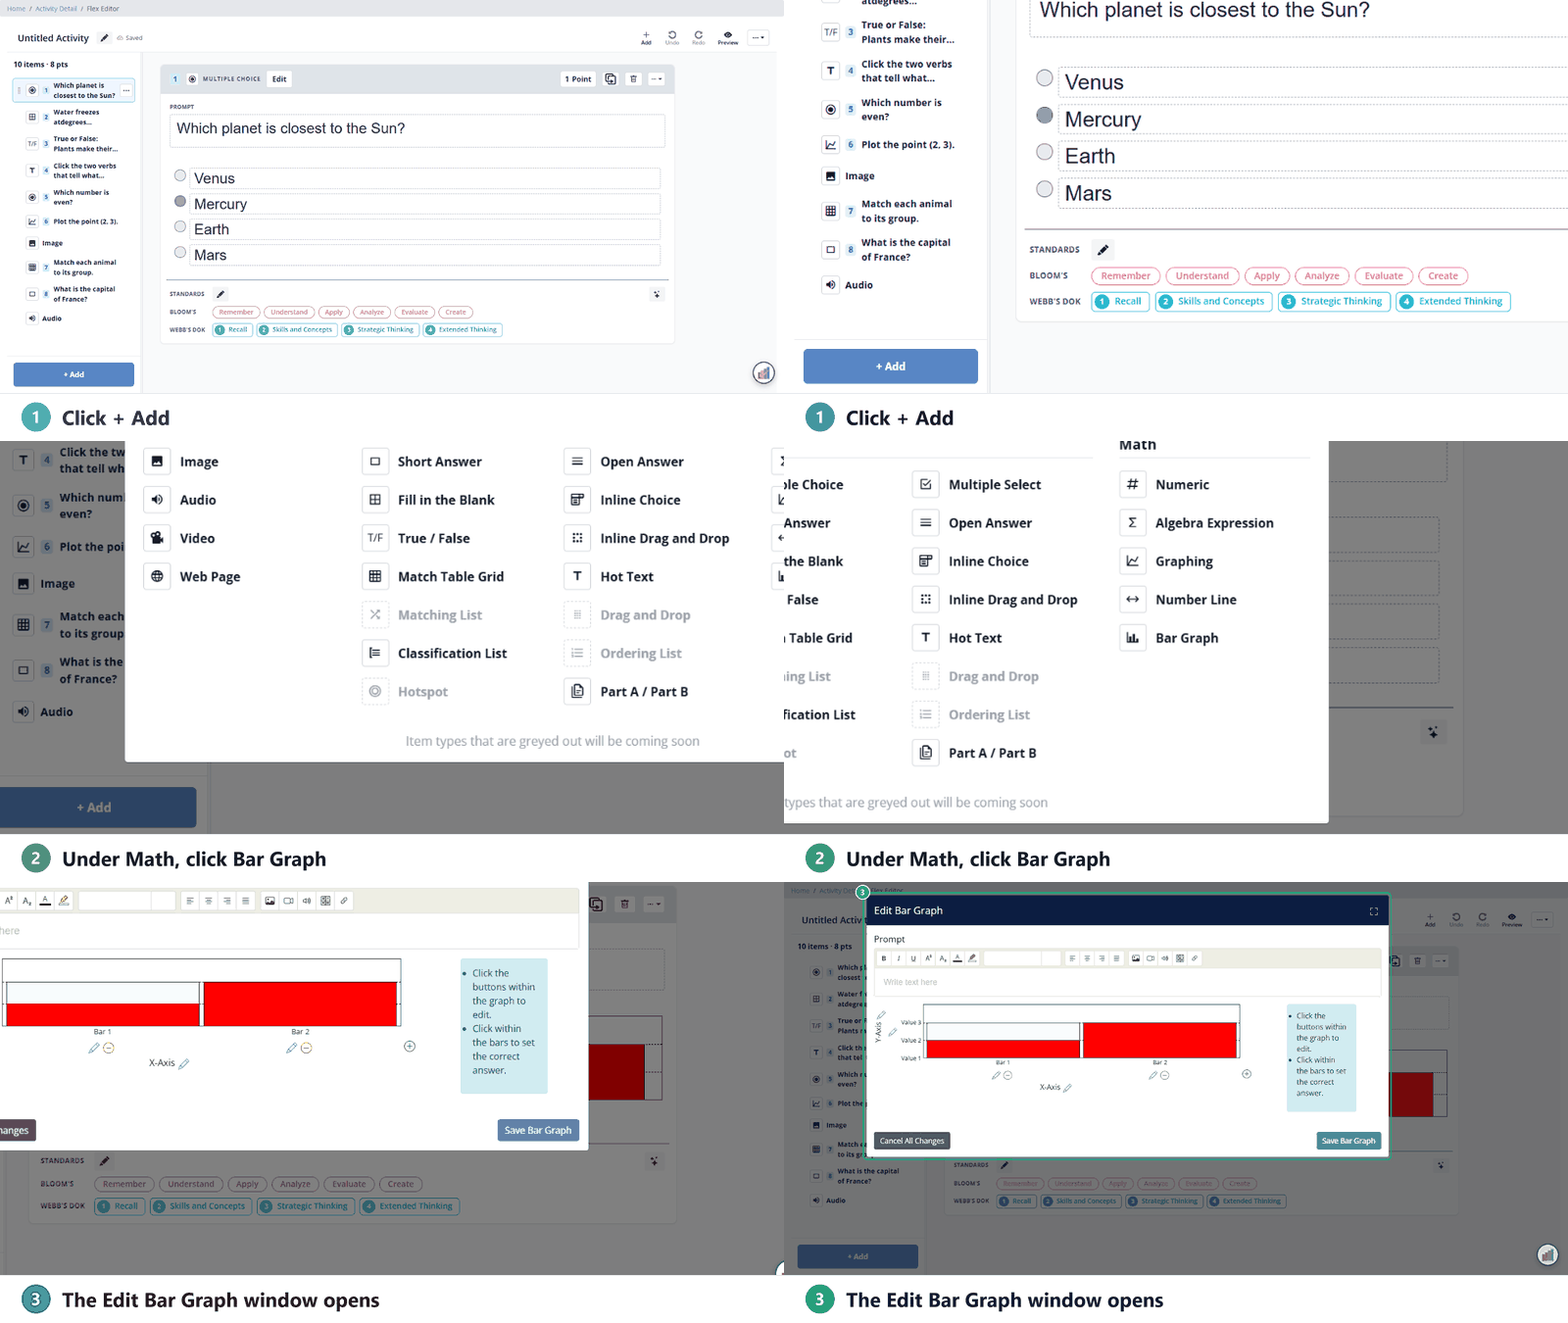
The question is added to your Activity as its own item. To change it later, open the item’s edit window again.
Add a Bar Graph in the Slide Editor
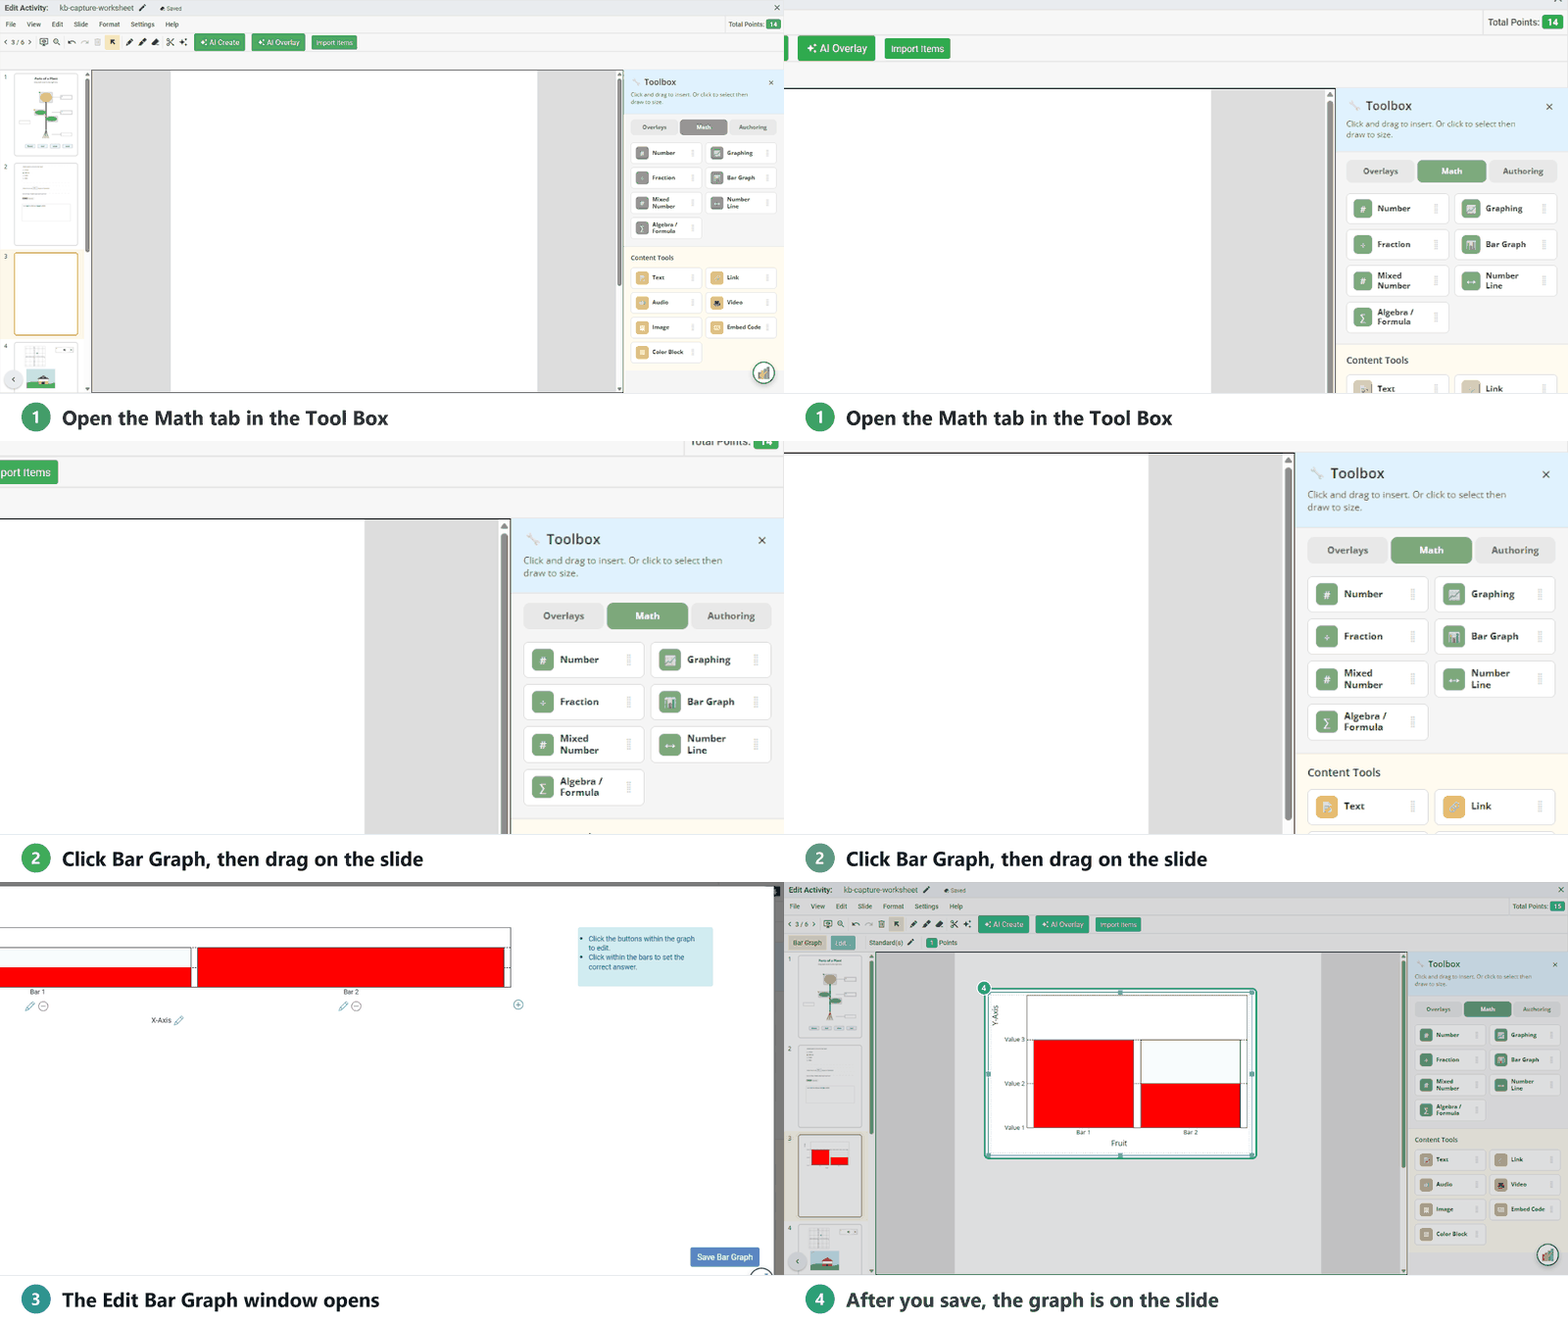
- In the Tool Box on the right, open the Math tab.
- Click Bar Graph.
- Click and drag on the slide to draw the graph at the size you want.
- The Edit Bar Graph window opens. If it doesn’t, select the graph and click Edit… in the toolbar.
Name the axes
Click the pencil next to X-Axis or Y-Axis and type the label in the box that opens on the right.

Set the scale
Click the second pencil by the Y-axis to open Edit Y-Axis Points.
- Click the green + to add a line.
- Click the red - to remove a line.
- Type a label for each line. You can leave some blank.

Add, remove and style bars
The graph starts with two bars.
- Click the green + at the right to add a bar.
- Click the red - under a bar to remove it.
- Click the pencil under a bar to change its settings.
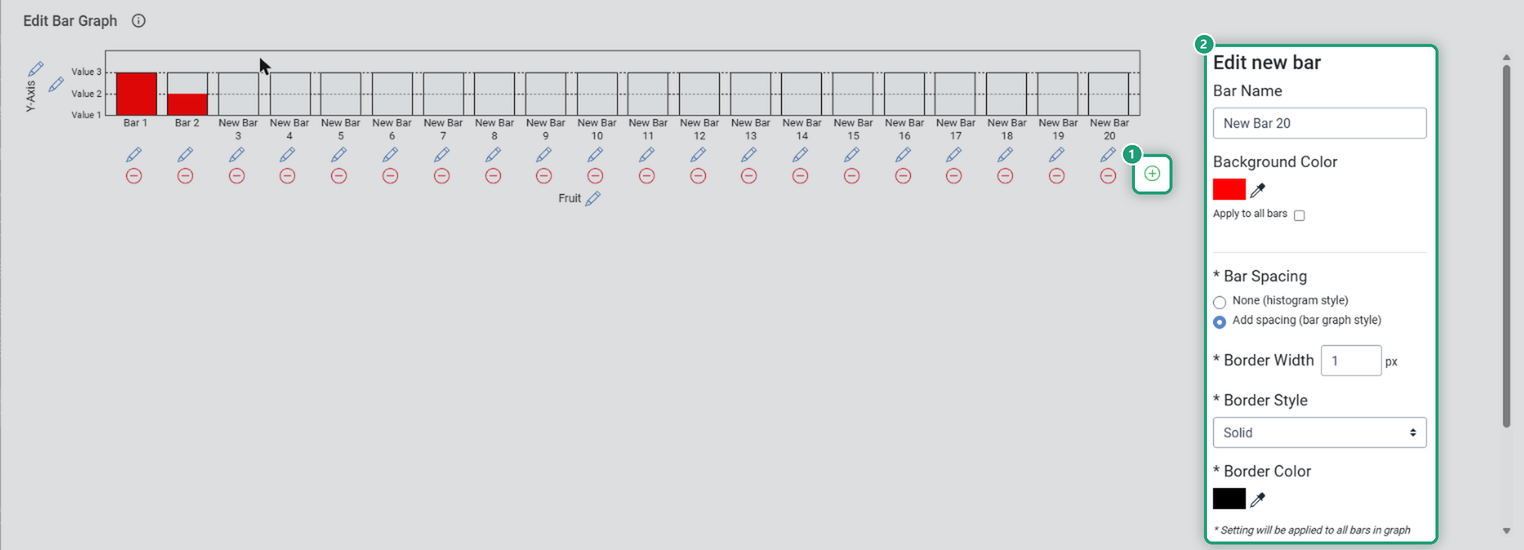
| Bar Name | The label under the bar. |
| Background Color | The fill color. Check Apply to all bars to use it on every bar. |
| Bar Spacing | None (histogram style), or Add spacing (bar graph style) for gaps between bars. Spacing and the border settings apply to every bar. |
| Border Width | How thick the outline is. |
| Border Style | The outline style. |
| Border Color | The outline color. |
Set the correct answers
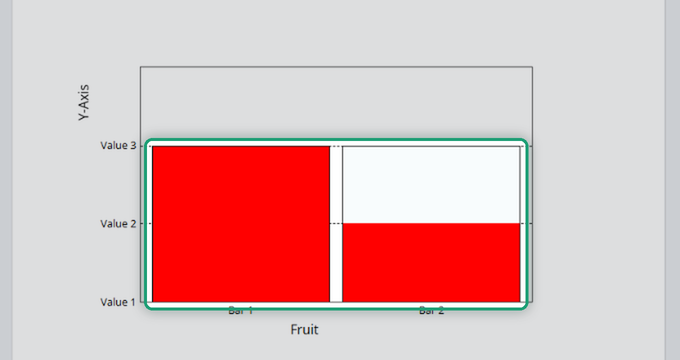
- Click inside each bar at the correct value. The bar shades from the X-axis up to that line. Click again to change it.
- Click Save Bar Graph.
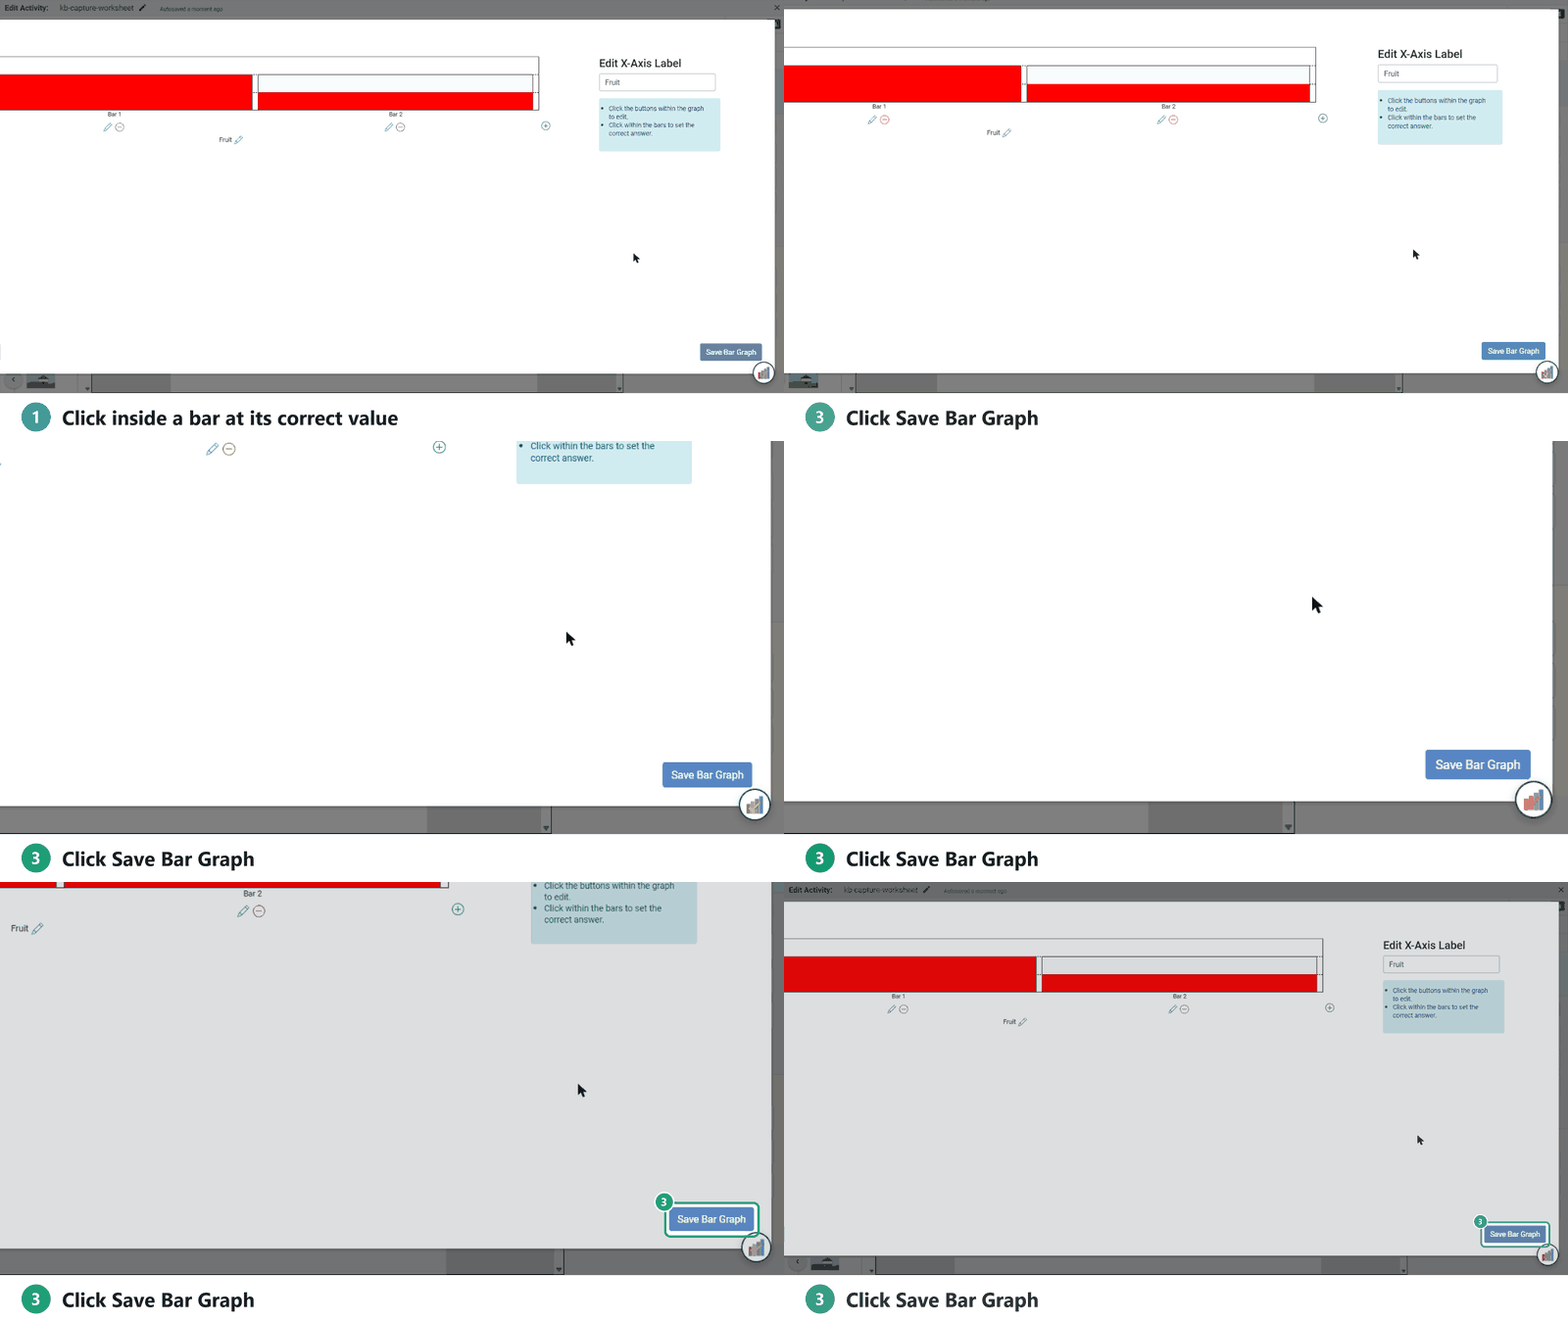
To throw away your changes instead, click Cancel All Changes and confirm.
What students see
Students see the graph with empty bars. They click inside each bar to set its value and can click again to change it.
Scoring
The question is scored when the student submits. Every bar must be correct for full credit; a partly correct graph earns no points.
Was this article helpful?
That’s Great!
Thank you for your feedback
Sorry! We couldn't be helpful
Thank you for your feedback
Feedback sent
We appreciate your effort and will try to fix the article